
Decoding the Ocean’s Whisper: Your Essential Surf Forecast Guide
There was a time, not so long ago, when reading the ocean meant standing on the sand, smelling the air, and feeling the water’s pull. My old man used to say, “The best forecast is your own two eyes and a lifetime of watching the horizon.” And while that wisdom still holds, today we’ve got incredible tools to help us decode the ocean’s whisper before we even leave the driveway. This isn’t just about looking at a single number; it’s about understanding the symphony of factors that create that perfect peeling wave or, conversely, a messy, unsurfable closeout.
When I first started, I’d just look at the wave height and paddle out, often finding myself totally out of my depth or, worse, completely skunked. It took years of getting tossed around and asking a lot of questions to the grizzled locals to truly understand how all the pieces fit together. This guide aims to short-circuit some of that struggle, giving you the insider knowledge to read a wave chart like a seasoned pro.
The Heartbeat of the Ocean: Understanding Swell Characteristics
The swell is the ocean’s heartbeat, carrying energy from distant storms across vast distances. It’s the primary engine of rideable waves. But it’s not just one thing; it’s a trinity: height, period, and direction. Miss one, and you’re missing a crucial piece of the puzzle.
Swell Height: The Potential Power
Swell height is often the first number surfers look at, indicating the average height of the biggest one-third of waves in a given swell train. A 6-foot swell might sound epic, but without context, it tells you very little. Think of it as the raw ingredient. A bigger number usually means more potential energy, but whether that translates to a rideable wave depends heavily on the other factors.
Insider Tip: Don’t just look at the forecast’s “wave height.” Look for “swell height.” Wave height is often a combination of multiple swells and local wind chop, which can be deceivingly large but offer no push. A deep-water buoy might report a 10-foot swell, but by the time it reaches your specific beach, due to refraction, bathymetry, and local conditions, it might be breaking at 4 feet. Conversely, a 3-foot groundswell with a long period can often produce far more powerful and rideable waves than a 5-foot short-period windswell.
Swell Period: The Breathing Room Between Waves
This is arguably the most critical and often misunderstood factor. Swell period refers to the time in seconds between two consecutive wave crests passing a fixed point. It’s the wave’s maturity, its journey from the storm’s birth. Short periods (under 7-8 seconds) often indicate local windswell – chaotic, jumbled energy that results in weaker, closely spaced waves. Longer periods (10+ seconds, especially 15+ seconds) mean a groundswell, originating from a powerful storm far away. These waves have “sorted themselves out,” gathering energy and creating clean, powerful lines with ample time between sets.

What it means for you:
- Short Period (3-7 seconds): Choppy, weak, messy. Lots of closeouts. Hard to catch, little power. Good for whitewater practice, maybe.
- Medium Period (8-12 seconds): Decent, but can still be a bit jumbled. Good for many beach breaks, offering a mix of power and rideability.
- Long Period (13+ seconds): Powerful, organized, fewer waves but more defined sets. These are the waves that allow you to really work on your Surf Techniques for Intermediate Surfers. They carry immense energy, enabling longer rides and more maneuverability.
When I’m looking at a chart, if I see a 2-foot swell with a 16-second period, my ears perk up more than a 6-foot swell with a 6-second period. That long period means serious push, even if the height looks small on paper.
Swell Direction: Where the Energy is Pointing
Swell direction tells you where the waves are coming from (e.g., W, SW, N). This is vital because every surf break is different; some spots love a southwest swell, others need a north. It all depends on the local bathymetry – the underwater topography. A break facing directly into the swell will receive the full brunt of its energy, while one sheltered by a headland might only catch a refracted portion.
Insider Tip: Learn your local spots’ optimal swell directions. Keep a mental (or physical) log. My home break, for example, is fickle. A slight shift from a WNW to a NW swell can turn it from perfect barrels to a mushy mess because of how the reef bends the energy. Understanding these nuances can be the difference between an empty lineup and a crowded one.
The Ocean’s Breath: The Crucial Role of Wind
Wind is the ultimate wave maker and wave breaker. It can turn a perfect swell into an unmanageable mess or groom an average day into something magical. I’ve been fooled more times than I care to admit by a promising swell, only to find the wind had shredded the face into unrideable chop.
Wind Speed and Direction
This is straightforward but critical:
- Offshore Wind (blowing from land to sea): Your best friend. It holds the wave up, creating a clean, steep face and often a hollow barrel. Light offshore wind (5-10 knots) is often ideal, creating a “glassy” surface.
- Onshore Wind (blowing from sea to land): Your worst enemy. It chops up the wave face, making it bumpy, crumbly, and often causing closeouts. The stronger the onshore wind, the worse the conditions.
- Cross-Shore Wind (blowing parallel to the coast): Can create texture and sometimes make one direction of rideable wave face better than the other, but generally less desirable than offshore.
Wind Strength: The stronger the wind, the more pronounced its effect. A light 5-knot onshore breeze might just put a bit of texture on the water. A 20-knot onshore gale will obliterate any rideable waves.
Insider Tip: Always check the wind forecast hour by hour. Often, the wind will be light offshore in the early morning (“glass-off”), then swing onshore by midday as the land heats up. That early alarm clock is often the price of admission for clean waves. Also, local topography can create micro-climates for wind. A certain canyon might funnel offshore wind even when the general forecast is light onshore.
The Ocean’s Rhythm: Tides and Bathymetry
Tides are the ocean’s breathing, the rhythmic rise and fall of water levels influenced by the moon and sun. Every surf spot reacts differently to the tide, and understanding this interaction is key to timing your session.
High Tide vs. Low Tide
Some breaks only work on high tide, others only on low, and some are best in between. This is entirely dependent on the underwater contours (bathymetry) of the specific spot.
- High Tide: Generally provides more water over shallow reefs or sandbars, which can make waves softer or, for some spots, allow them to break cleanly without hitting the bottom too hard. Might “drown out” some spots, making them too deep for waves to break.
- Low Tide: Often makes waves steeper, faster, and sometimes heavier due to less water over the break. Can expose rocks and reefs, making conditions more dangerous. Some point breaks or specific reef breaks come alive at low tide.
- Mid Tide (incoming or outgoing): Many beach breaks are best on a pushing or falling mid-tide, as the water movement and depth create ideal conditions for waves to peel.
Insider Tip: This is where local knowledge truly shines. Ask experienced surfers or watch how different spots react to different tides. I always synchronize my sessions using a dedicated, high-precision marine tide watch from tracking pioneers like Nixon, which lets me track shifting water depths directly from the lineup. When I first started at my local beach break, I learned that a specific sandbar only worked on an incoming mid-tide with a particular swell direction. If I missed that window, I was guaranteed a frustrating session. Never underestimate the importance of tide for a spot’s quality and safety.
Advanced Forecast Elements: Buoy Data & Wave Models
While standard surf forecast sites (like Surfline, Magicseaweed, WillyWeather) do a great job of consolidating information, the truly experienced surfer often digs a little deeper.
Reading Buoy Data
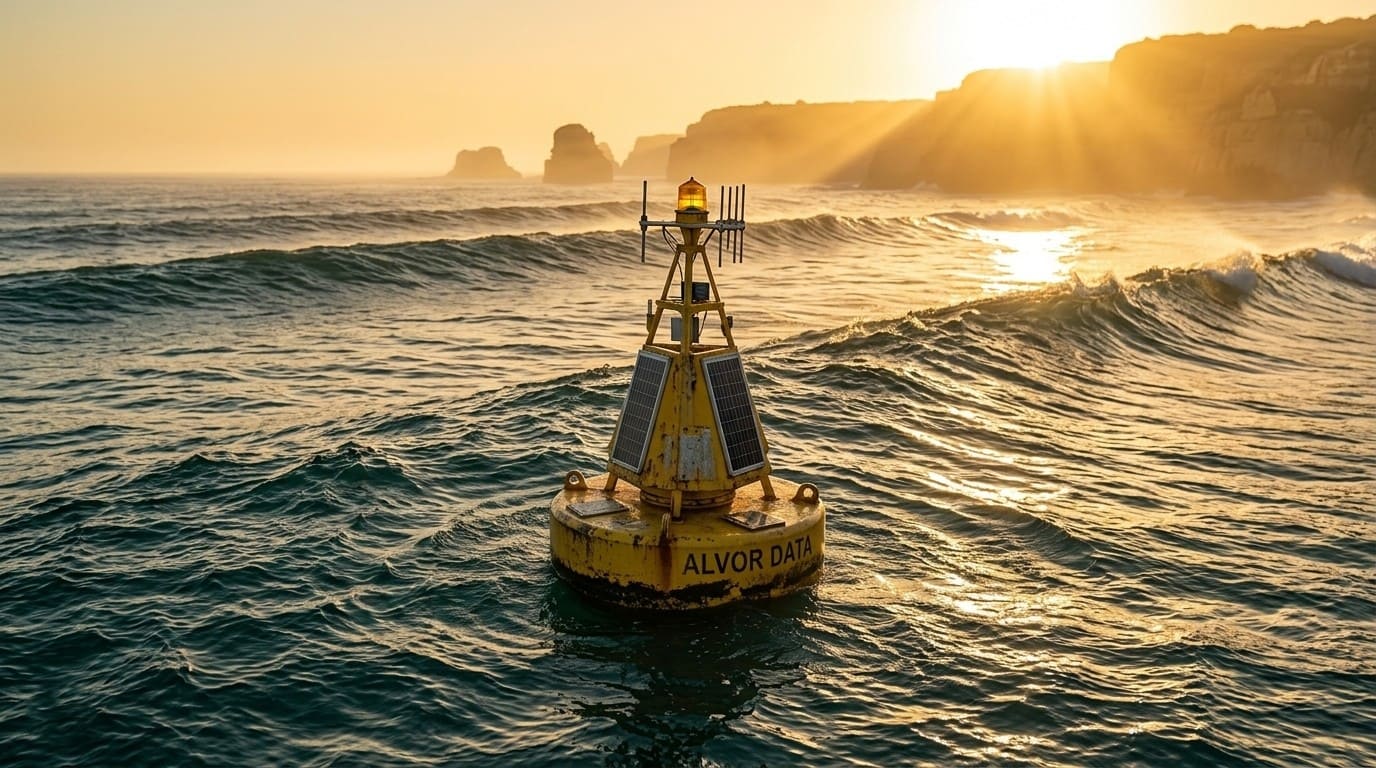
Buoys are the eyes and ears of the ocean, measuring real-time swell data offshore. Checking the nearest deep-water buoy can give you an unvarnished truth about the swell before it hits the coast. Compare the buoy readings (especially swell height and period) to the forecast. If the buoy is showing a much smaller or larger swell than predicted, adjust your expectations.
Understanding Wave Models
Forecast sites use complex computer models (like GFS, WW3, ECMWF) to predict swell. Each model has its strengths and weaknesses, and sometimes comparing them can give you a more nuanced picture, especially for long-range forecasts. However, for most everyday surfers, sticking to the reputable forecast sites is sufficient.
Putting It All Together: Your Pre-Surf Checklist
To avoid a wasted trip or, worse, a dangerous paddle out, here’s a quick checklist I run through before I grab my board:
| Factor | What to Look For | Why It Matters |
|---|---|---|
| Primary Swell Height | The biggest number in feet/meters. | Indicates potential wave size and power. |
| Primary Swell Period | Time between waves (in seconds). Look for 10+ for good groundswell. | Crucial for wave power, organization, and rideability. Long period = quality. |
| Primary Swell Direction | Where the swell is coming from (e.g., SW, NW). | Ensures the swell is hitting your chosen spot correctly. |
| Local Wind Direction | Offshore (land-to-sea) is best. Cross-shore tolerable. Onshore is usually bad. | Determines wave face quality (clean vs. choppy). |
| Local Wind Speed | Light (0-10 knots) is ideal. Strong wind (15+ knots) can ruin conditions. | Impacts the degree of chop and surface texture. |
| Tide Chart | High, low, incoming, outgoing. Match to your spot’s preference. | Alters wave shape, power, and safety depending on the break. |
| Buoy Data (if applicable) | Check nearest deep-water buoy for real-time swell data. | Verifies forecast accuracy and gives current ocean conditions. |
The smell of salt in the air, the distant roar of a set, the cold flush of my wetsuit as I pull it on – these are all part of the ritual. But armed with a good understanding of the forecast, I know I’m not just hoping for waves; I’m making an informed decision about where and when to find the best conditions for my skill level. It’s about respecting the ocean, and knowing when to paddle out, and more importantly, when to hold back.
Frequently Asked Questions About Reading Surf Forecasts
What’s the difference between “wave height” and “swell height”?
Swell height refers to the height of the waves generated by a distant storm, carrying organized energy. Wave height often refers to the total sea state, which includes swell, but also local wind chop and multiple overlapping swells, making it less indicative of rideable wave quality.
Why is a longer swell period better for surfing?
A longer swell period means the waves have traveled further and are more organized. They carry more energy, are typically cleaner, and have more time between sets, allowing for easier paddling out and better ride selection. This translates to more powerful, consistent, and rideable waves.
How does wind direction affect wave quality?
Offshore wind (blowing from land to sea) is ideal as it grooms the wave face, making it smooth and steep. Onshore wind (blowing from sea to land) creates chop and can cause waves to crumble, making them less rideable. Cross-shore wind can cause uneven conditions but is generally less detrimental than strong onshore.
Can I trust surf forecasts completely?
Surf forecasts are highly accurate for general trends, especially for swell. However, local conditions, especially wind and very specific bathymetry, can introduce variations. Always cross-reference multiple sources, check real-time buoy data, and remember that forecasts are predictions, not guarantees. The ultimate forecast is always what you see when you get to the beach.
What does “bathymetry” mean and why is it important for surfing?
Bathymetry refers to the underwater topography of the ocean floor. It’s crucial because the shape of the seabed directly influences how waves break. Reefs, sandbars, and deep channels can bend, magnify, or diminish swell energy, determining a wave’s shape, power, and whether it breaks as a hollow barrel, a mellow peeler, or a closeout.